Best Places to Invest in UK Property: Yield vs Capital Growth
October 4, 2026
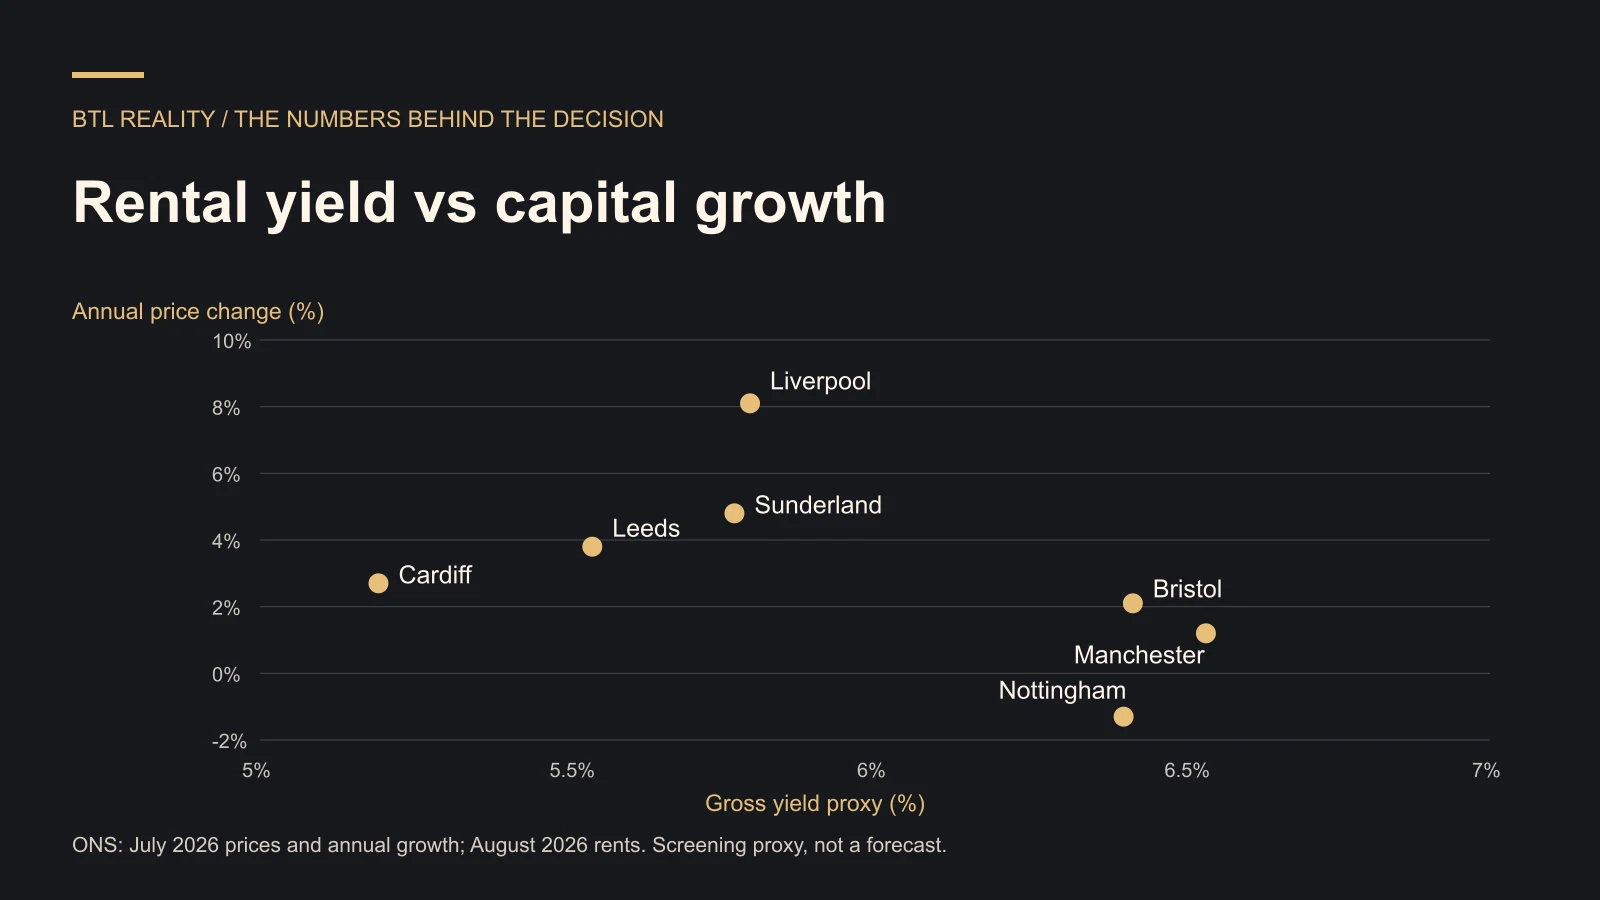
The best place to invest in UK property depends on whether you need income now, long-term capital growth, or a balance of both. The latest local ONS figures available for this comparison show very different combinations. Manchester has a stronger indicative rent-to-price ratio than Liverpool, while Liverpool recorded much faster annual house-price growth. Neither fact makes every property in either city a good purchase.
This guide compares real published data, explains what the figures can and cannot tell you, and gives you an interactive way to test the income side. My starting point is a property that can stand on its own numbers. Future growth can strengthen a plan, but relying on it to rescue weak cash flow creates a different risk.
The data and the limits of this comparison
The main table uses selected local authorities in England and Wales: July 2026 average house prices and annual price changes, alongside August 2026 average private rents. The ONS local pages were updated on 16 September 2026 and checked for this article on 4 October. Prices are provisional, figures are not seasonally adjusted and revisions can change the comparison.
7 October market update: the latest Lloyds September house-price release and valuation stress test adds a newer national and regional mortgage-based view. It is a different measure from the local ONS data below, so use it as context rather than replacing or mixing the figures.
The indicative gross yield proxy is our calculation: average monthly rent multiplied by twelve, divided by average house price. It is not an official ONS rental-yield statistic. The homes represented in the rent and sale-price measures are not a matched investment portfolio, and the reference months differ. Use it to screen areas, not to underwrite a particular deal.
The shortlist deliberately mixes lower and higher entry-price markets. It is not an exhaustive ranking of every UK location. We discuss Glasgow and Belfast separately because the rental geographies and data methods differ. Combining them into one apparently precise city league table would hide those differences.
Rental yield versus capital growth: the real-data table
| Area / source | July price | August rent/month | Gross yield proxy | Annual price change |
|---|---|---|---|---|
| Manchester | £252,000 | £1,373 | 6.54% | +1.2% |
| Liverpool | £189,000 | £913 | 5.80% | +8.1% |
| Sunderland | £147,000 | £707 | 5.77% | +4.8% |
| Leeds | £248,000 | £1,145 | 5.54% | +3.8% |
| Nottingham | £190,000 | £1,014 | 6.40% | -1.3% |
| Cardiff | £272,000 | £1,177 | 5.19% | +2.7% |
| Bristol | £352,000 | £1,883 | 6.42% | +2.1% |
The source link in each row goes to the relevant ONS local page. Our percentages use the rounded price and rent figures displayed there. Annual capital appreciation is the published change in the house-price measure, not our calculation from rounded prices. No number in the table is a forecast or a promised investment return.
What the comparison actually tells us
Manchester and Nottingham are among the stronger areas in this shortlist on the gross yield proxy, at approximately 6.54% and 6.40%. Their recent price performance is different: Manchester was up 1.2% over the year and Nottingham down 1.3%. That is a useful reminder that rental income and capital appreciation do not necessarily move together.
Liverpool recorded the strongest annual price growth in this seven-area table, at 8.1%. Its gross yield proxy is about 5.80%, with an average price of £189,000. It deserves further research for someone seeking a balance, but repeating 8.1% every year in a forecast would turn one observation into an unsupported promise.
Sunderland has the lowest average entry price here, at £147,000, with a 5.77% proxy and 4.8% annual price growth. Lower entry cost can help a limited budget, but a city average says nothing about the repairs, street-level demand or mortgage suitability of the specific low-priced home you find.
Bristol challenges the simplistic idea that every southern market has a weak gross ratio. Its £1,883 monthly average rent and £352,000 price produce a proxy of about 6.42%. The much larger purchase amount still affects deposit cash, acquisition costs and exposure in pounds. Leeds and Cardiff show lower proxies in this sample, alongside positive annual price changes.
Why I would not simply add yield and growth
A tempting shortcut is to add a 6% yield to 5% house-price growth and call it an 11% return. That leaves out voids, management, repairs, insurance, financing, purchase costs, tax and selling costs. It also combines spendable rent with a valuation movement that may never be realised at the assumed price.
Our table is even less suitable for that shortcut because its yield proxy combines two different statistical populations. There is no single property earning the average rent while necessarily moving by the average price index. Treat the figures as two research signals, then build a complete model for the actual home.
Capital growth can be powerful over time, but it can also be flat or negative. Leverage magnifies the effect on equity in both directions. Refinancing depends on valuation, affordability, lender criteria and available products. A rising city index does not guarantee that you can release cash from your own property when you want it.
Test the income side yourself
6 October 2026 update: Fleet’s latest rental barometer offers a useful reminder that gross yield is only the starting point. Our Q3 rental yield and cashflow analysis includes a worked example and calculator showing how a higher mortgage rate can outweigh extra rent. Its lender sample is different from the ONS measures used in this guide, so compare the methods before comparing headline percentages.
Choose an area and adjust the operating-cost allowance, empty weeks, mortgage loan-to-value and interest rate. This is a rough area-level scenario using the displayed averages. The tool applies operating costs to collected rent and assumes an interest-only loan against the average price. It excludes purchase costs, capital repayments, major works and tax.
Test a location under your assumptions
Uses area averages, not a matched rental property. Gross yield is a rent-to-price proxy. Annual price change is historical and is not included as spendable income. Excludes tax, purchase costs, principal repayment and major works. Values stay on this page.
JavaScript is required to change the results. The figures above show the default worked example.
For example, Manchester's average inputs produce £16,476 annual gross rent. Four empty weeks reduce approximate collections to £15,209. Deducting a 25% operating allowance and interest at 5.5% on 75% of £252,000 leaves about £1,011 a year before tax, or £84 a month. These assumptions are illustrative, not observed local costs.
That result explains why a promising gross ratio is only a starting point. Change the financing or running costs and the outcome changes quickly. A real purchase below the comparable market value might improve the arithmetic, but a discount needs evidence and may come with work or risk. Use the buy-to-let deal calculator for the property-specific assessment.
What about Scotland and Northern Ireland?
The ONS Glasgow page reports a July 2026 average house price of £194,000 and annual growth of 2.6%. Its £1,266 August rent relates to Greater Glasgow's broad rental market area, not the same boundary as Glasgow's house-price area. Scotland's rent data are mainly advertised new lets. We therefore do not rank a calculated Glasgow yield against the main table.
The ONS Belfast page reports £185,000 for April to June 2026 and 7.7% annual growth. The £1,134 June rent refers to the Belfast rental market area, while the local authority overlaps multiple rental areas. Northern Ireland's rent data use advertised new lets and house prices are quarterly. Those are material comparability differences.
Both locations may justify research. The right next step is to gather matched property-level purchase and rent evidence, then examine the relevant nation's acquisition taxes, tenancy rules and landlord obligations. England's Renters' Rights Act guidance should not be pasted into a Scottish, Welsh or Northern Irish investment plan.
How to turn an area shortlist into a buying brief
Start with available cash and the income you need. A higher-priced location might require so much deposit and acquisition cash that it leaves insufficient reserves. A cheaper location might allow more flexibility, but buying several weak properties does not become diversification simply because there are more front doors.
Then choose the property type and tenant need you understand. Compare similar houses or flats within realistic neighbourhoods. Check transport, competing rental supply, condition, lease terms where relevant and local licensing. Our rental-demand research guide provides a practical evidence checklist.
Finally, test a cautious case: lower rent, more empty weeks, an unexpected repair and a less favourable refinancing outcome. If the deal requires constant appreciation and perfect occupancy, its attractive position on a city chart is not enough. The mortgage stress calculator helps examine one of those pressures.
Which places would I investigate first?
For a constrained budget, I would begin by examining suitable properties in the lower-entry-price locations, including Sunderland and Liverpool, while checking whether the actual local rents and condition support the purchase. For income screening, Manchester and Nottingham deserve a look because of the ratios in this snapshot. That is a research shortlist, not a blanket recommendation to buy there.
For a larger budget or an existing local advantage, Bristol, Leeds or Cardiff could still make sense. Your access to reliable agents, contractors and genuine off-market knowledge may matter more than a small difference between area proxies. Do not pay a premium simply because a city appears on a “best places” list.
The broader location-selection guide explains the wider process. If you want BTL Reality to source against an agreed brief, explore Done For You property sourcing. Agree the objectives and constraints first, then judge the individual opportunity on evidence.
Frequently asked questions
Where in the UK has the best rental yield?
There is no universal answer without specifying property type, data source and costs. In this selected England-and-Wales comparison, Manchester has the highest calculated gross ratio. It is an area screening proxy, not the net yield on a purchasable property or a ranking of every UK market.
Is Liverpool better than Manchester for property investment?
This snapshot shows faster annual price growth in Liverpool and a higher gross rent-to-price proxy in Manchester. That does not settle the investment decision. Compare actual properties, total acquisition cash, demand, running costs and financing against your own objectives.
Should I prioritise rental yield or capital appreciation?
If you need regular income, test cash after costs, financing and tax first. If you can hold for a long period, potential growth may play a larger role, but it remains uncertain. A balanced plan should survive a period when prices do not rise.
Are northern cities always better than southern cities?
No. Lower prices can improve accessibility, but neither direction of the compass establishes a good deal. Bristol's gross proxy in this sample illustrates why broad stereotypes are unreliable. Street, property type, purchase price and operating costs can change the result substantially.
Can I use last year's growth rate for the next ten years?
Use it as historical context, not an automatic forecast. Model a range that includes flat or falling prices and keep future assumptions explicit. One strong year may reflect conditions that do not persist, and revised data can alter the original picture.
Why are Glasgow and Belfast outside the yield chart?
Their rent and house-price geographies do not match cleanly, and the data methods or periods differ from the main sample. We show the source figures separately rather than imply a like-for-like comparison. Use matched local property evidence before deciding what an individual investment could earn.