Is Property Falling in Value After Inflation?
July 11, 2026
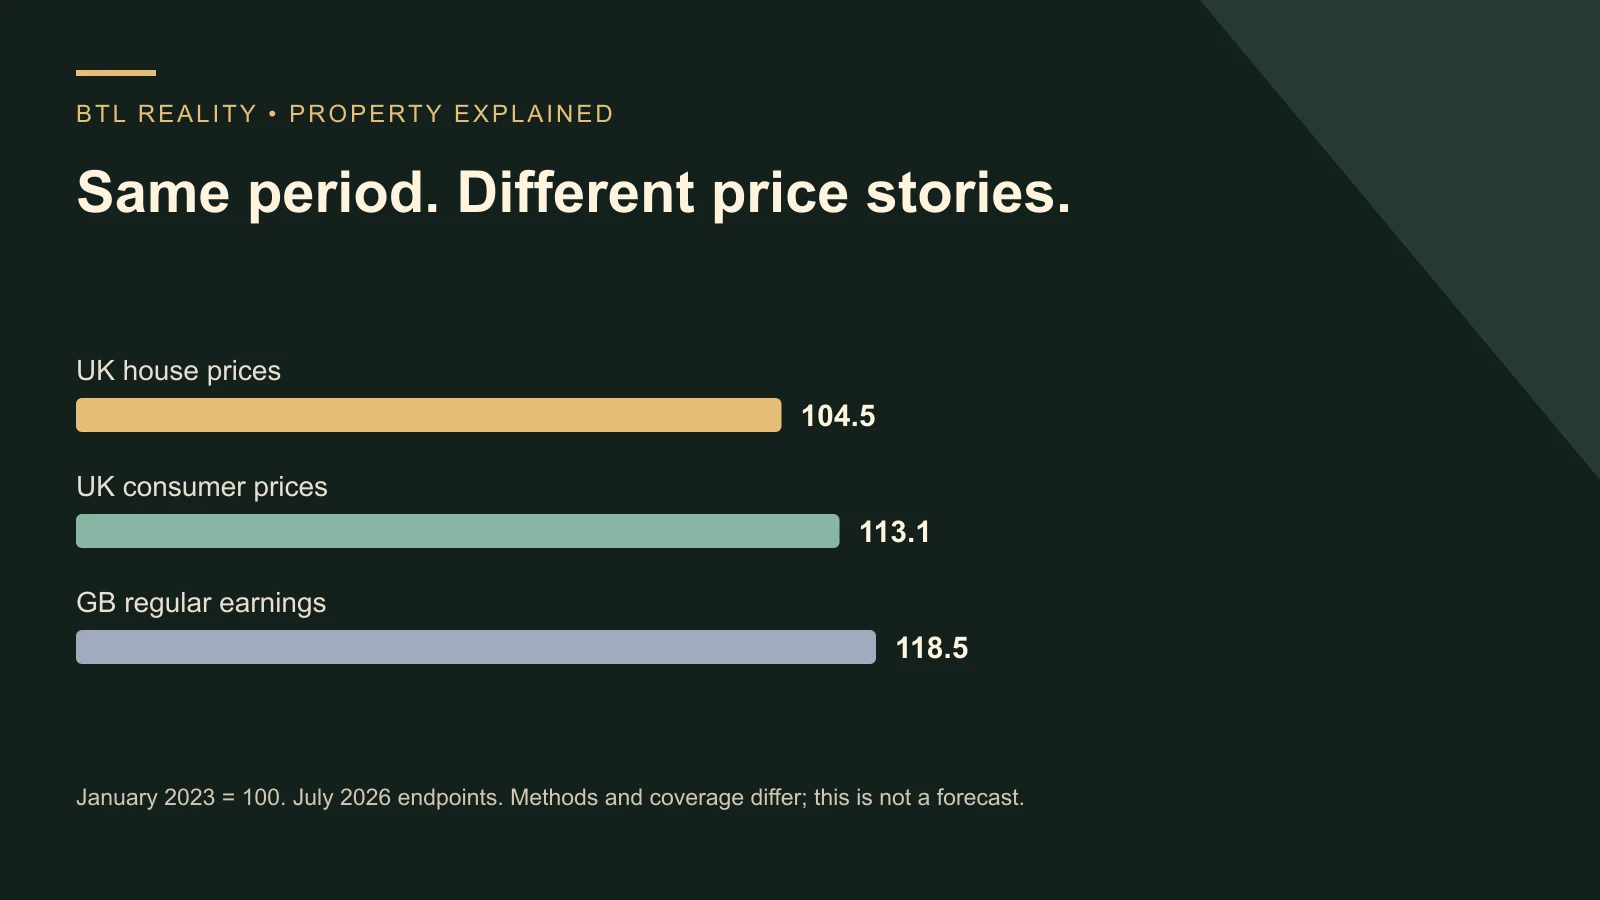
UK property can rise in cash terms while falling in value after inflation. The distinction is between the price on the sale contract and what that amount of money can buy. If house prices rise more slowly than the general price level, their inflation-adjusted value has fallen over that period.
The cumulative comparison is especially revealing. Between January 2023 and July 2026, the official series used below show house prices rising much less than consumer prices or regular earnings. That helps explain why a market can feel stagnant even when the national average has not collapsed in pounds.
It does not prove that property must catch up, that every region is cheap or that an individual buyer can afford more. Interest rates, deposits, household circumstances and local property conditions still matter. This guide separates the calculations so you can use the data without turning a historical comparison into a guaranteed prediction.
Cash prices and real prices answer different questions
A nominal price is the amount paid in pounds at the time. A real price adjusts that amount using a chosen inflation measure. Neither number is inherently the “true” price for every purpose: they answer different questions.
Suppose a house rises from £150,000 to £165,000, a nominal increase of 10%. If consumer prices rise 20% over the same period, the later house price expressed in starting-period pounds is £137,500: £165,000 divided by 1.20. Its real price has fallen by 8.33%, despite the £15,000 nominal increase.
The calculation is a ratio. Subtracting 20% from 10% gives a rough comparison of growth rates, but it is not the exact real return. The precise calculation is 1.10 divided by 1.20, minus one. This matters when cumulative changes become large or you compare different starting periods.
Separate nominal growth from purchasing power
Use the same start and end dates for all inputs. This is a scenario, not live data. Excludes rent, debt, costs and tax; compare CPI and earnings separately.
What the cumulative UK figures show
For a consistent starting point, set January 2023 equal to 100 for three separate series. By July 2026, the UK house-price index is 104.5 on that basis. The CPI series becomes approximately 113.1, while regular earnings become approximately 118.5.
The sources are the HM Land Registry July 2026 UK HPI summary, the ONS CPI all-items series D7BT and the ONS regular weekly earnings series KAI7. CPI moved from 126.4 to 142.9, and the earnings series from £595 to £705.
That means nominal house prices rose about 4.5%, CPI about 13.1% and the selected earnings measure about 18.5%. These are cumulative changes across the selected period, not annual growth rates. The chart shows the endpoints rather than implying a smooth path between them.
How far behind inflation and wages are prices?
Relative to CPI, the calculation is 104.5 divided by 113.0538, minus one. The result is approximately a 7.6% real house-price decline. Relative to the selected earnings series, 104.5 divided by 118.4874, minus one gives a fall of approximately 11.8%.
There is a second, different question: how much would the house-price index need to rise from 104.5 to match those fixed July 2026 benchmark levels? Matching 113.0538 would require about 8.2%. Matching 118.4874 would require about 13.4%.
Those catch-up percentages are not the same as the earlier percentage falls because the denominator changes. They are also not forecasts. Consumer prices and wages will continue to move, and there is no economic rule requiring house prices to return to either particular ratio.
Do not add the 8.2% and 13.4% together. CPI and wages are two separate comparisons, not two bills that property must repay. Combining them would double-count different ideas and create a misleading claim about an inevitable price rise.
The important limitations of the comparison
The house-price and CPI series cover the UK, while the earnings series covers Great Britain. Regular earnings are seasonally adjusted and exclude bonuses; the chosen house-price series is not seasonally adjusted. They are useful broad indicators, but the methods and populations are not identical.
January 2023 is a stated comparison baseline, not a claim that every market reached a peak in that month. Choosing a different start date changes the result. A responsible chart shows the dates clearly so the reader can understand the question being asked.
The wage comparison is not the official median house-price-to-earnings affordability ratio. It compares movements in an average regular-pay series with movements in an aggregate house-price index. It cannot tell you the deposit, mortgage eligibility or disposable income of a particular household.
Why affordability may still feel difficult
A home’s purchase price is only one part of the monthly cost. Higher mortgage rates can offset a lower price-to-wage ratio. A buyer also needs the deposit and purchase costs, and their own income may not have increased in line with the national average.
Consider an interest-only loan of £112,500. At 3%, annual interest is £3,375, or £281.25 a month. At 6%, it is £6,750, or £562.50 a month. The property has not changed, but the monthly interest cost has doubled. Repayment mortgages have a different payment calculation because capital is repaid too.
This is why “cheaper in real terms” and “easier to buy” can move in different directions. Use the interest-rate guide for the distinction between Bank Rate and mortgage products, and obtain an actual quote before judging your financing position.
My experience is useful context, not a national forecast
In my earlier video, I discussed buying my first London property in 2010 and described its nominal value as roughly three times the original purchase price by the time of the discussion. That is a personal example over a particular period and location, not a claim that every property bought now will triple.
The point behind the story is that holding for a long period can make the cash gain look substantial, while inflation still changes what those pounds represent. You need to consider both the capital movement and the income, costs and financing over the holding period.
You can watch the original discussion alongside this updated data. Historical figures mentioned in the video reflect that discussion’s date. The calculations on this page use the stated January 2023 to July 2026 comparison and should not be read as a valuation of my individual property.
A real house-price change is not an investor’s total return
An investor may receive rent, pay mortgage interest, fund repairs, incur purchase costs and eventually pay selling costs and tax. An index comparison contains none of those individual cash flows. A negative real house-price movement does not automatically mean every landlord made a loss, and a positive movement does not guarantee a profitable investment.
Debt magnifies changes in equity. If a £150,000 property has £112,500 debt, the starting equity is £37,500 before transaction costs. A 10% fall in the property value is £15,000, reducing that simple equity figure to £22,500 if the debt is unchanged. That is a 40% fall in the starting equity, not merely 10%.
The same leverage can magnify gains, but it also creates interest and refinancing risk. Inflation does not make those obligations disappear. Use the buy-to-let deal calculator to examine the cash flows separately from a capital-growth assumption.
Does this create an opportunity for 2027?
A lower price relative to inflation or earnings can be part of a constructive argument, particularly if financing improves and local demand remains strong. It is not enough to establish the size or timing of a recovery. Supply, employment, household confidence and lending conditions can pull in different directions.
Mark’s view that 5% growth could be possible if oil and borrowing pressures ease is a scenario worth testing. It remains an opinion about a possible future, not a result mechanically implied by the historical gap. Lower oil prices do not guarantee a particular Bank Rate decision or a specific mortgage offer.
The separate UK property price predictions for 2027 article compares dated professional forecasts with that scenario. Keep the forecast, historical evidence and your own underwriting assumptions in separate columns. That makes the reasoning much easier to challenge constructively.
Use the data in a purchase decision
Start with the local property: achievable rent, supported value, condition, legal use and full costs. Then use the macroeconomic picture to stress-test the decision. Ask what happens if prices remain flat, refinancing is unavailable on hoped-for terms or income needs to fund a large repair.
If you are building the framework for your first investment, Starter Club provides structured education and discussion. For a broader view of timing, read is now a good time to buy UK property?. Neither replaces appropriate professional advice about your finances or the property.
A useful investment case can survive an honest explanation of uncertainty. If the only reason to buy is that an index “must” catch up, the case needs more work. The historical comparison is valuable precisely when it helps you ask better questions rather than claim certainty.
Frequently asked questions
Can house prices rise while falling after inflation?
Yes. If nominal house prices rise more slowly than the chosen inflation measure over the same period, their real value falls. A 10% price rise alongside 20% cumulative inflation produces an approximately 8.33% real decline, calculated using the ratio of the two growth factors.
How far have UK house prices lagged inflation since January 2023?
Using the stated official series through July 2026, the comparison indicates an approximately 7.6% real decline. That depends on the chosen dates and measures and may change with revisions. It is an aggregate index comparison, not the valuation history of every UK property.
Are house prices also lower relative to wages?
Over this selected period, the UK house-price index rose less than the GB regular-earnings series used here. The relative decline is approximately 11.8%. This is not the official median affordability ratio, and it does not establish how an individual household’s income or borrowing capacity changed.
Must property prices catch up with inflation eventually?
No. There is no fixed rule requiring an index to return to a chosen historical relationship. Real house prices can remain weak or fall further, and wages and inflation continue changing. Catch-up calculations illustrate a comparison with a fixed benchmark, not a promised future return.
Should I add wage inflation and CPI together for a price forecast?
No. They measure different things and should be compared with house prices separately. Adding their cumulative growth rates produces a misleading combined catch-up claim. Use wages for an earnings-relative comparison and CPI for purchasing-power adjustment, with the dates and limitations clearly stated.
Does falling real property value mean buy-to-let is unprofitable?
Not necessarily. An investor’s total result also includes rent, finance, maintenance, fees, tax and timing. An index movement alone does not calculate those cash flows. Model the individual deal and downside scenarios rather than treating either nominal or real capital growth as the entire return.