UK Property Price Predictions 2027: Could Prices Rise 5%?
October 3, 2026
UK property price predictions for 2027 point to a range of possible outcomes, not a result anybody can promise. Published forecasts examined for this guide include 2.5% growth from Savills and 3% from Knight Frank. My own optimistic scenario is 5%, if energy pressures ease, mortgage finance becomes cheaper and buyers regain confidence.
That is a view to test, not a reason to buy any property at any price. A national average can rise while your flat falls. A property can gain value while its owner loses money through expensive borrowing, repairs or an unsuitable purchase.
Here is how I would compare the forecasts, work through the numbers and decide whether an individual deal remains attractive if the optimistic outcome never arrives. Figures and sources were checked on 4 October 2026. This is educational analysis, not a personalised investment recommendation.
What are the published forecasts for 2027?
Savills’ forecast published on 1 June 2026 puts UK growth at 2.5% in 2027. Knight Frank’s update of 27 April 2026 forecasts 3%. Those are dated forecasts, not a live consensus or lender promise. Both were published before the September Bank of England decision.
My 5% scenario sits above those figures. It is not an institutional forecast, and I am not presenting it as equally researched or statistically probable. It is a conditional view that readers can challenge by changing the assumptions below.
Comparisons also need matching definitions. A forecast for average selling prices is not interchangeable with asking-price growth, prime London performance or an individual city. Check the geography, measure, forecast period and publication date before placing percentages in the same chart.
Why I think 5% growth is possible
My optimistic case starts with oil prices easing. If that reduces broader inflation pressure, it could create more room for lower interest rates. Cheaper mortgage finance would then improve what buyers can afford for a given monthly payment.
There are several links in that chain, and each can fail. Oil can fall without domestic inflation settling quickly. The Bank can hold rates while it waits for evidence. Mortgage pricing can remain expensive because lenders’ funding costs, competition and risk assessments also matter.
The current evidence does not justify treating cuts as imminent. The Bank of England held Bank Rate at 3.75% in September, with three members favouring an increase. That is a material challenge to the optimistic case. Our interest-rate outlook explains the distinction between Bank Rate and mortgage offers.
I would want to see sustained improvement in inflation, actual mortgage quotations and completed-sale evidence before becoming more confident. A good narrative is useful for forming a hypothesis. It does not replace checking whether the expected changes are happening.
What is happening to prices now?
The ONS September release estimates the average UK house price at £273,000 in July 2026, up 1.4% annually. July is the reference month; September is the publication month. The provisional estimate may be revised.
Within England, annual growth ranged from 4.9% in the North East to a 3.3% fall in London. That spread is a warning against applying a UK forecast mechanically to every postcode. A regional average also hides differences between flats, houses, streets, condition and price brackets.
Completed-sale data arrive with a lag. An asking-price cut today, a mortgage approval and a completed transaction each describe a different stage of the market. I would use national data for context and local comparable sales for the actual buying decision.
Prices versus inflation: the gain you can actually compare
July’s annual house-price growth of 1.4% was below July CPI inflation of 2.9%. Using those rounded rates for the same month, the real change was approximately minus 1.46%: 1.014 divided by 1.029, minus one.
That does not mean every owner received a lower offer. It means the average price bought less relative to the general consumer-price basket. Nominal value and purchasing power answer different questions.
For a forward-looking example, suppose a £150,000 property rises 5% to £157,500 during 2027. If inflation over that same period is 3%, its value in starting-year pounds is about £152,913. The nominal gain is £7,500; the inflation-adjusted gain is approximately £2,913, before costs and tax.
If inflation instead reaches 5%, a 5% price rise produces no real increase in the asset’s purchasing power. If prices rise 3% while inflation is 5%, the real change is about minus 1.90%. Our real-terms house-price guide explores this further.
Test your 2027 scenario
Illustrative 2027 scenarios. No probability is assigned. Excludes rent, debt, fees and tax. Compare inflation and wages separately.
How far have prices fallen behind inflation and wages?
One year does not capture the adjustment since borrowing became more expensive. Take January 2023 to July 2026, a common starting and finishing period. January 2023 is the current UK House Price Index base, not a claim that it was the market peak.
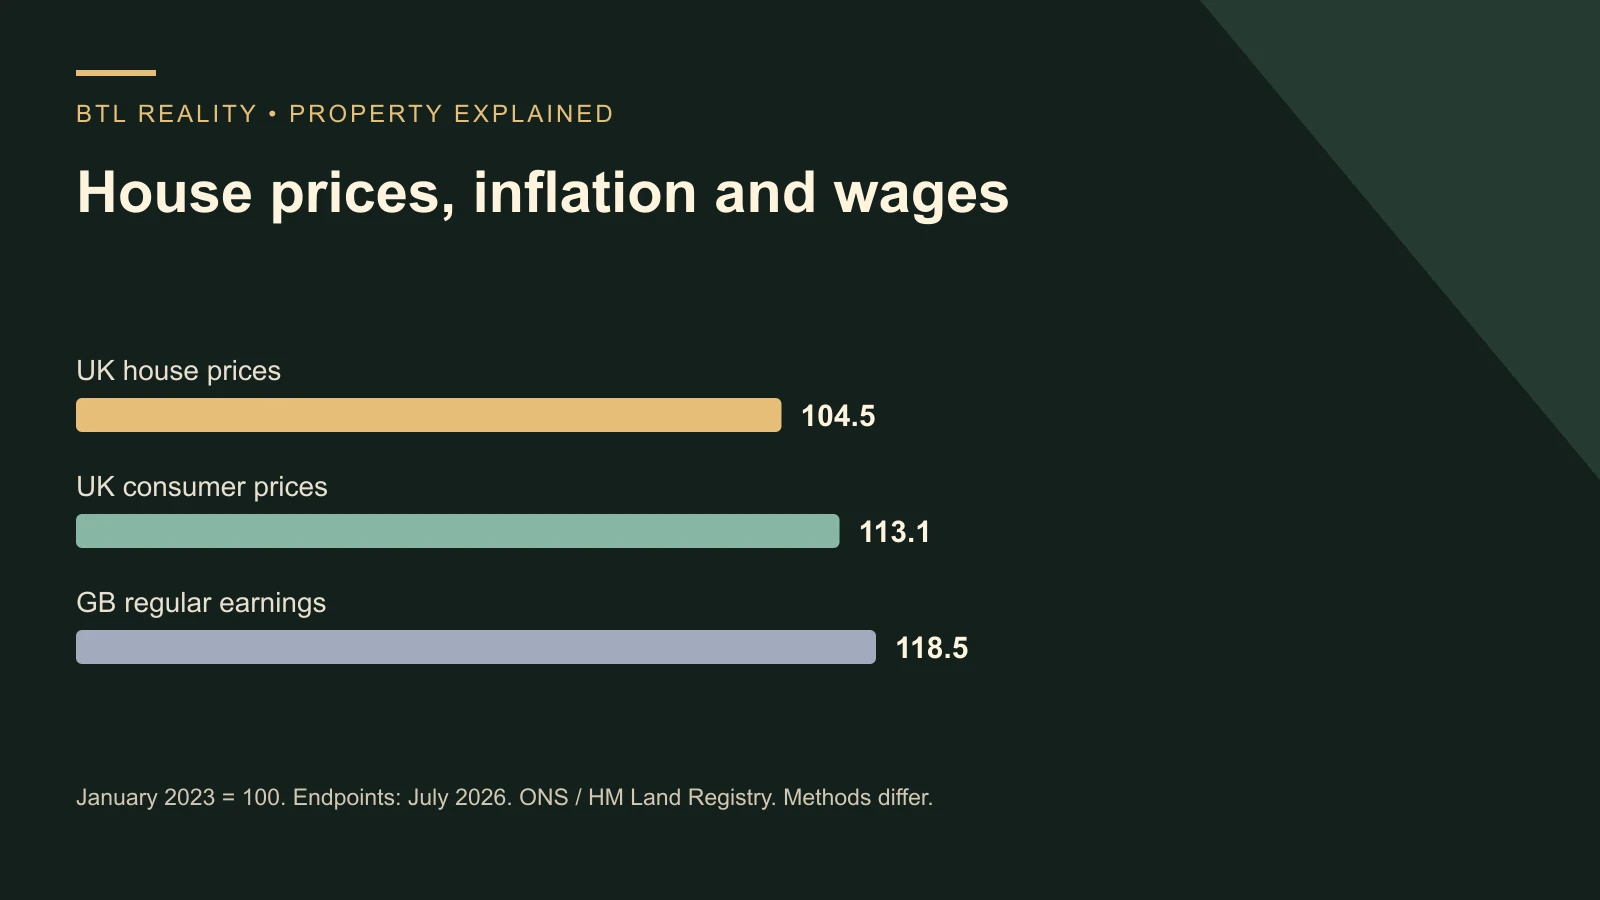
The official UK HPI moved from 100 to 104.5. Over the same months, CPI moved from 126.4 to 142.9, while regular weekly earnings moved from £595 to £705. Rebase each series to 100 at the start and the endpoints become:
- House prices: 104.5, a cumulative rise of 4.5%.
- Consumer prices: 113.1, a cumulative rise of about 13.1%.
- Regular earnings: 118.5, a cumulative rise of about 18.5%.
Dividing the house-price change by each benchmark shows prices about 7.6% lower after CPI inflation and 11.8% lower relative to regular earnings over this window. Simply subtracting percentage changes would not give the exact relative change.
That supports the argument that a meaningful adjustment can occur without a dramatic nominal crash. To regain the starting relationship against those fixed July benchmarks would require about 8.2% price growth against CPI or 13.4% against earnings. These are historical comparison gaps, not forecasts, fair-value estimates or targets prices must reach. Future inflation and pay growth would move the benchmarks again.
The comparison uses UK house prices and CPI alongside Great Britain regular pay. Pay is seasonally adjusted, while these HPI and CPI figures are not; earnings composition and provisional estimates also matter. It is a broad context chart, not the official median house-price-to-earnings affordability measure. A different starting date can produce a different conclusion.
Do not add inflation and wage growth together and deduct both from prices. These are two separate comparisons. Buyers still face deposits, mortgage payments and household bills, so an improving price-to-pay relationship does not guarantee an affordable purchase.
What cheaper mortgages could change
Consider an illustrative £112,500 repayment mortgage over 25 years. At 5%, the payment is about £658 a month. At 4%, it is about £594. That difference is roughly £64 monthly before product fees. These are calculated scenarios, not available mortgage quotations.
For an interest-only loan of the same size, annual interest divided by twelve produces £468.75 at 5% and £375 at 4%. That is a £93.75 monthly difference, but the principal remains outstanding. Repayment and interest-only figures should never be compared as though they buy the same outcome.
A lower rate can improve an existing investment’s cashflow when its deal actually changes. It can also encourage competing buyers. Neither effect guarantees a particular increase in value. If prices rise enough, a new buyer may need a bigger deposit even while the monthly financing rate falls.
A landlord’s gain is not simply the house-price forecast
Imagine buying for £150,000 using £37,500 deposit and £112,500 interest-only debt. A 5% value increase would add £7,500 to gross equity, taking it from £37,500 to £45,000 if the debt stayed unchanged. That is a 20% increase relative to the deposit alone.
It is not a 20% investment return. The calculation omits purchase tax, legal fees, borrowing charges, maintenance, rent, operating costs, selling expenses and tax on any gain. Include all cash invested when judging your return. Equity also becomes spendable only through a sale or an approved borrowing arrangement.
Leverage works in reverse. A 5% fall takes the property to £142,500 and gross equity to £30,000, also a 20% movement relative to the original deposit. A lender’s valuation can differ from your expectation, and refinancing depends on affordability and lending criteria as well as equity.
How I would underwrite a 2027 purchase
I would model at least three cases: a price fall, flat values and an upside case. Use the same property, initial cash and cost assumptions so that the comparison is meaningful. Then test higher mortgage costs and a repair independently. Several problems can happen together.
The buy-to-let deal calculator is a useful place to examine cash required and rental cashflow. Do not let the growth assumption hide a rental that is already losing money. A paper gain does not pay a contractor unless you can access cash.
Buy below a defensible market value where possible, but verify the discount using comparable completed sales and the home’s actual condition. A vendor’s original asking price is not proof of market value. Allow for local demand, licensing, energy works and the cost of making the home suitable to let.
If you want help developing that discipline, Starter Club is our educational route. If you want a property sourced against an agreed brief, see Done For You. Neither service can guarantee 2027 price growth. The free calculators are available without joining either.
Frequently asked questions
Will UK house prices rise by 5% in 2027?
It is possible, but not established. My 5% case depends on improving conditions and sits above the dated Savills and Knight Frank forecasts compared here. Plan for outcomes below it, including no growth or a fall, before committing money.
What is the latest UK house-price forecast for 2027?
Forecasts differ and are revised. The publications checked here include Savills’ June 2026 forecast of 2.5% and Knight Frank’s April 2026 forecast of 3%. Check the linked publication dates before relying on them; a newer economic event does not automatically update an older forecast.
Will falling oil prices make UK property more expensive?
They could help ease inflation pressure and support cheaper borrowing, but the relationship is indirect. Other inflation pressures, jobs, wages, lender funding costs and housing supply can change the outcome. Lower oil alone is not evidence that a property will rise in value.
Is 5% house-price growth good if inflation is 3%?
It represents approximately 1.94% real asset growth over the same period, calculated as 1.05 divided by 1.03 minus one. Whether the investment is attractive also depends on rent, all costs, tax, borrowing and the amount of cash committed.
Do rising wages make homes more affordable?
They can, when income rises faster than prices and other household costs do not absorb the benefit. The monthly mortgage payment and deposit still matter. An average earnings increase cannot establish an individual buyer’s borrowing capacity or a tenant’s sustainable rent.
Should I wait until 2027 to buy a rental property?
There is no universal answer. Compare a specific deal now with your reserves, time horizon and realistic alternatives. Waiting may help if your finances or knowledge need work, but predicting the perfect purchase month is much harder than assessing a well-evidenced deal.