How Long Does It Take to Double Your Money?
October 19, 2026

By Mark Parham
BTL Reality · Practical property education
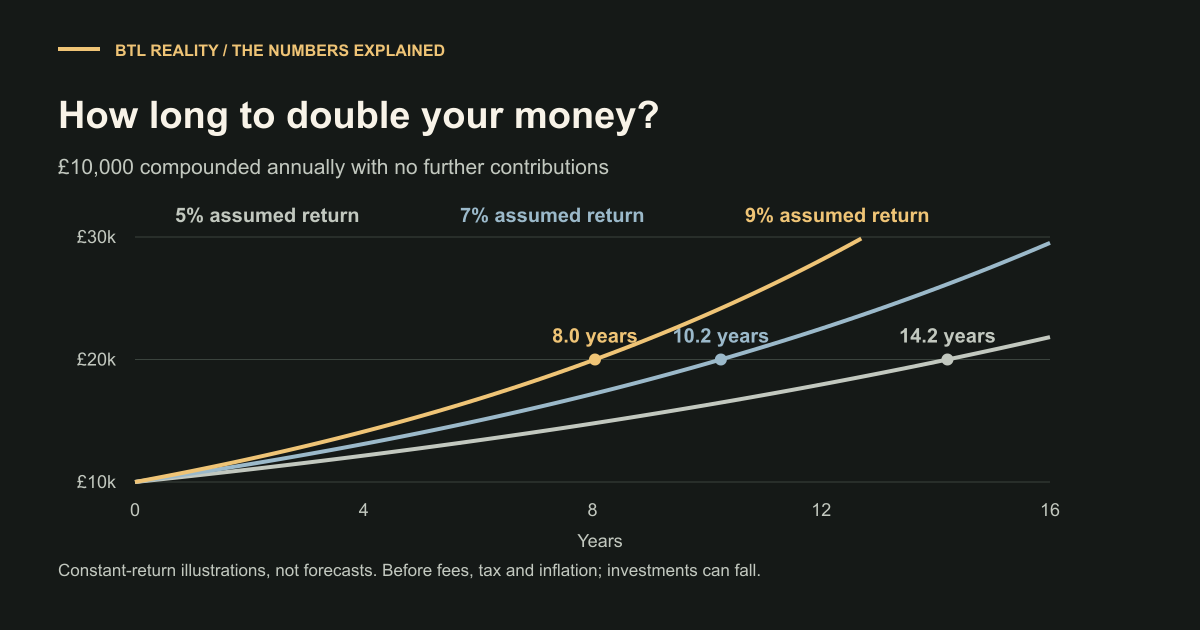
At a constant 7% annual return, money takes about 10.2 years to double before fees, tax and inflation. At 5% it takes about 14.2 years; at 9%, about 8 years. Those are mathematical illustrations, not predictions that an investment will deliver those returns or follow a smooth path.
The useful lesson is how time, contributions, costs and purchasing power interact. A doubling target can make compounding easier to understand, but it should not replace a plan for what the money is meant to do.
The Rule of 72 gives a quick estimate
Divide 72 by the annual percentage return to estimate the number of years required to double. At 6%, that gives roughly twelve years. At 9%, it gives roughly eight. It is a convenient mental shortcut, not an exact formula.
The exact constant-growth calculation is log(2) divided by log(1 + the annual return as a decimal). You do not need to calculate logarithms by hand; the tool below does it. What matters is understanding that the return is assumed to repeat and remain invested.
| Assumed return | Rule of 72 estimate | Exact mathematical doubling time |
|---|---|---|
| 5% | 14.4 years | 14.2 years |
| 7% | 10.3 years | 10.2 years |
| 9% | 8.0 years | 8.0 years |
The fractional time is the mathematical point on a constant-growth curve. If a particular account only credits interest at set intervals, the observed balance reaches the target according to those terms. Market investments do not credit a guaranteed annual percentage in this way.
Use 5%, 7% and 9% as scenarios, not promises
We use these as lower, middle and higher growth illustrations for longer-term market-investment modelling. The lower figure is not a safe return, and the middle figure is not guaranteed or universally realistic for every portfolio. Asset mix, fees, market conditions and the time period matter.
The FCA explains the relationship between risk and returns: investments can fall in value, and taking more risk does not guarantee a higher reward. Choose assumptions to investigate possibilities, not to make a desired deadline appear certain.
For money needed on a fixed near-term date, a market fall could matter much more than a long-run average. Our deposit-saving guide deliberately starts with a no-growth cash model for that reason.
TRY YOUR OWN ASSUMPTIONS
Test growth, fees and inflation
See how a constant-return illustration changes when costs and purchasing power are included. No monthly contributions are assumed.
Move a slider to explore the model.
Annual growth applied first, then the annual fee: net multiplier = (1 + growth) × (1 − fee). Real multiplier = net multiplier ÷ (1 + inflation). No tax or contributions. Constant rates are assumptions, not market forecasts; actual investments can fall. Inputs stay on this page. Figures stay on this page and are not submitted or saved.
Enable JavaScript to use the sliders. The default worked example remains readable below.
A doubling time does not depend on the starting pot
Under the same constant percentage return, £1,000 and £100,000 take the same mathematical time to double. The larger pot produces a much larger gain in pounds, but the percentage growth is identical.
At 7% with no fees, £10,000 becomes about £19,672 after ten years. £100,000 becomes about £196,715 under the same assumptions. Neither example includes additional saving, withdrawals or tax.
Years to double at three constant growth assumptions
Fees change the growth that stays invested
A fee reduces the amount left to compound. In the tool, growth is applied first and the annual percentage fee is then deducted from the resulting value. That makes the method explicit rather than quietly subtracting an unexplained round amount.
For example, 7% growth followed by a 1% fee produces a multiplier of 1.07 × 0.99 = 1.0593, equivalent to 5.93% net growth in this simplified model. Doubling then takes about twelve years rather than about 10.2.
Real charging structures may include fixed fees, platform charges, fund costs and transaction costs at different times. Use the actual terms when assessing an investment. The purpose of the slider is to show why seemingly small ongoing costs deserve attention.
Doubling pounds is not doubling purchasing power
If prices rise while your money grows, the future pot buys less than the same number of pounds would buy today. Adjusting for inflation means dividing the investment growth multiplier by the inflation multiplier.
At 7% growth and 2.5% inflation with no fees, the real annual multiplier is 1.07 ÷ 1.025, or approximately 1.0439. Doubling purchasing power takes about 16.1 years under that smooth scenario, compared with about 10.2 years to double the nominal pounds.
Inflation is also uncertain. Use several scenarios and connect the target to real spending needs. A retirement income or property purchase target is more meaningful when you consider what it must buy, not merely whether the account balance has reached a pleasing round number.
Contributions can matter more than the return assumption
If you are starting with a smaller pot, regular saving can be the main driver of progress. Adding £500 a month means £6,000 of new contributions over a year before any return. That is a different source of growth from compounding the original money.
Do not describe a balance that doubled because you added more money as an investment earning 100%. Separate contributions from investment gains. Our full compound interest calculator lets you explore the effect of regular contributions alongside the starting pot.
A practical plan should include an amount you can maintain, a time horizon and a review process. A slightly higher assumed return cannot reliably compensate for contributions you cannot afford or money withdrawn earlier than planned.
Real returns do not arrive in a straight line
A 20% fall requires a 25% subsequent gain just to return to the original value. If £10,000 falls to £8,000, a 20% recovery produces only £9,600. The percentage is applied to a different starting balance each time.
This is why an arithmetic average of annual returns does not necessarily describe compound growth. Volatility, the order of returns and the timing of contributions or withdrawals can affect the journey. The smooth lines in a teaching chart are useful for explaining a formula, but they hide that uneven path.
The FCA’s diversification guide explains how spreading investments can reduce dependence on one outcome, while not eliminating risk. Consider the portfolio as a whole and seek personal advice where appropriate.
Property growth needs its own model
A property’s value doubling is not the same as an investor’s money doubling. Debt, purchase costs, rental cashflow, repairs, tax and sale costs all affect the investor’s result. Leverage can magnify both gains and losses in equity.
My portfolio account describes purchases, borrowing and refinancing across many years. It should not be reduced to a single smooth annual return or treated as a template that every property will repeat.
Use the portfolio calculator for property scenarios and the compound calculator for a simpler market-growth illustration. Keeping the models distinct prevents a borrowed refinance receipt from being mistaken for investment growth.
Turn the illustration into a useful next step
- Define the purpose. Identify what the money is for and when it may be needed.
- Separate contributions from growth. Show how much progress comes from saving.
- Include costs and inflation. Compare nominal pounds with spending power.
- Test less favourable outcomes. Lower growth or an early loss should be visible.
- Review without chasing the chart. Update the plan when circumstances change, rather than forcing a target return.
Start with the compound interest calculator and save a set of clearly labelled scenarios. If the goal is eventually buying a rental property, connect the target to the complete purchase cash budget rather than stopping at a generic doubling milestone.
Can money double without taking investment risk?
Mathematically, positive interest can compound over time, but actual account terms, rates, tax and inflation matter. No rate used in this article is an available-product recommendation or a guarantee.
What happens if growth after fees is zero or negative?
The starting pot does not double through growth under that constant scenario. The tool shows this explicitly rather than displaying an invalid or misleading number of years.
Prepared using information checked on 30 September 2026. Check the linked product pages for current availability and terms. This is general property education, not personal financial, mortgage, tax or legal advice. Models and examples are illustrative. Property values and income can fall, and outcomes are not guaranteed.