Best Northern Cities for Property Investment: 2026 Guide
October 2, 2026
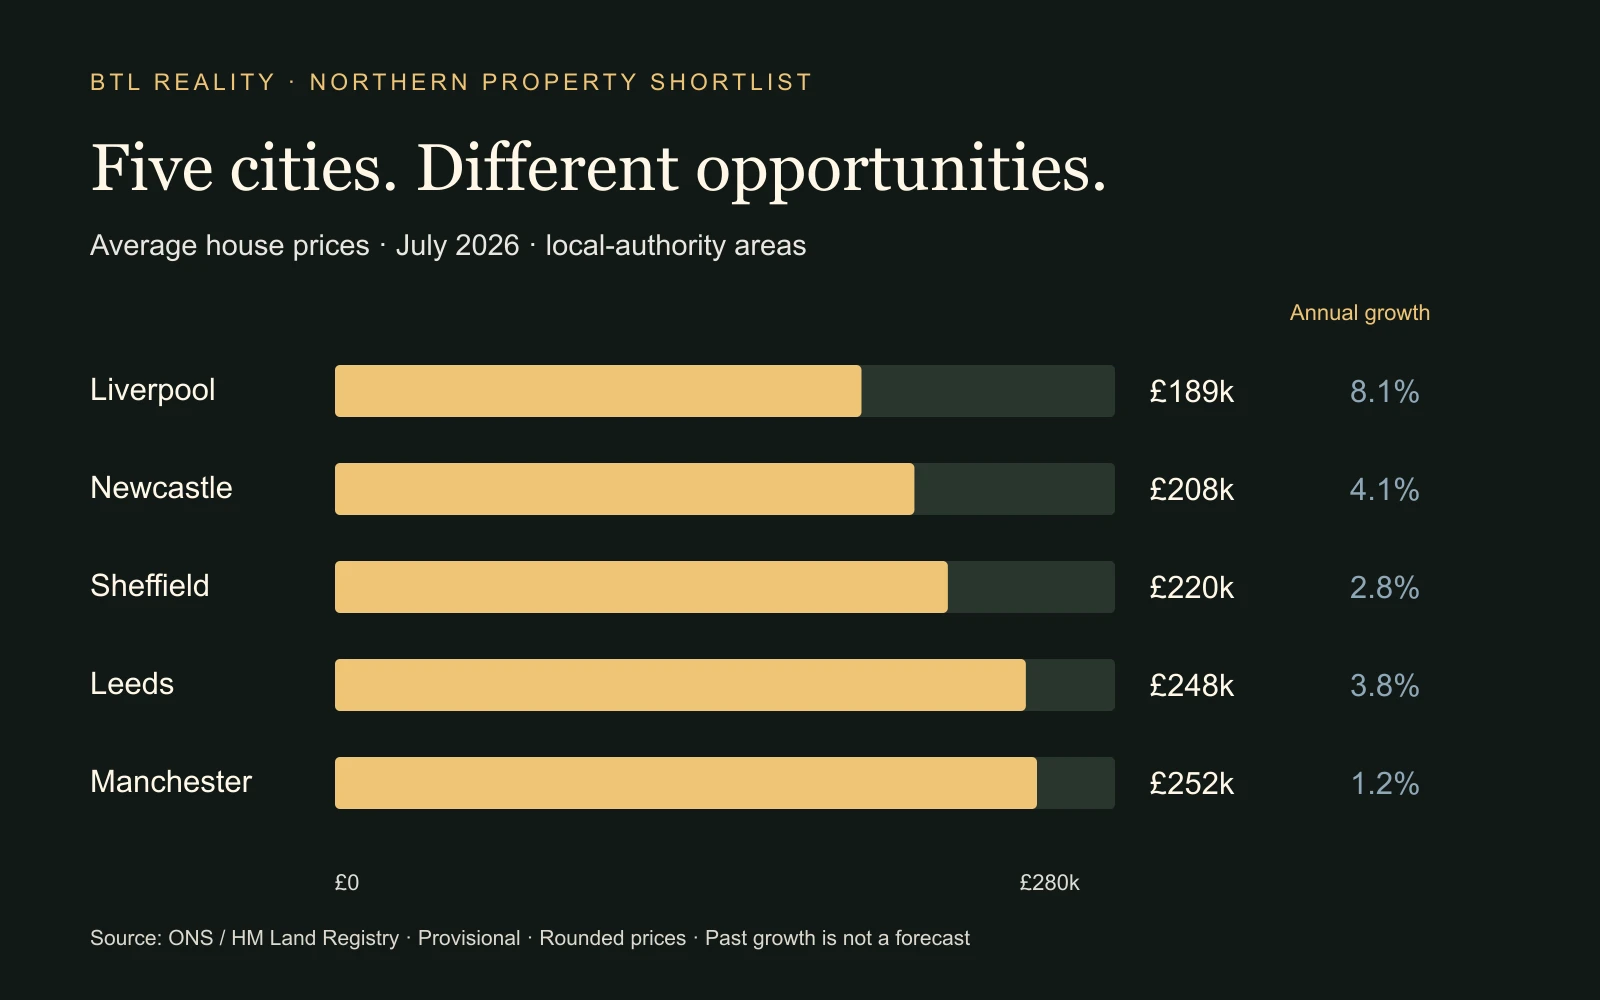
If I were building a shortlist for a cashflow-focused UK property investment, Northern cities would be near the top. Liverpool, Newcastle, Sheffield, Leeds and Manchester all deserve investigation. The attraction is the possibility of buying at a price that leaves a workable relationship between rent, debt and running costs, with a credible local reason for people to live there.
That is a starting point, not a claim that every Northern postcode is a bargain. The best place to invest is somewhere the individual property works, the demand is evidenced and you can manage the investment properly. Here is how I would compare these five markets, what the latest official figures say, and why lower borrowing can help when mortgage rates rise.
Why Northern cities belong on the shortlist
Lower purchase prices can reduce the deposit and mortgage required for a comparable investment budget. If the rent remains strong relative to that price, there may be more room for finance costs, repairs and a useful monthly surplus. That relationship matters more to a landlord than a city's position on a fashionable hotspot list.
The latest ONS September 2026 release reported annual private-rent inflation of 5.8% in both the North East and North West in August, compared with 3.0% in the South East. That is evidence of recent rental-price pressure at regional level. It does not prove demand for a particular flat, or establish the rent a new landlord can charge.
The opportunity I would investigate is a combination: a manageable purchase price, tenants who want the specific location, sensible running costs and potential for improvement over time. A low price without those other ingredients may simply describe a difficult property.
Five cities to research, with the numbers dated
The comparison below uses local-authority average house prices for July 2026 and annual changes to that month. Figures are provisional and can be revised. They cover a mixture of property types, so they are context for your research, not the price of a ready-made investment package. Manchester city is not the same geography as Greater Manchester, and the same boundary discipline matters elsewhere.
| City | Average price | Annual price change |
|---|---|---|
| Liverpool | £189,000 | 8.1% |
| Newcastle upon Tyne | £208,000 | 4.1% |
| Sheffield | £220,000 | 2.8% |
| Leeds | £248,000 | 3.8% |
| Manchester | £252,000 | 1.2% |
Sources: ONS and HM Land Registry, September 2026 releases; checked 2 October 2026. Provisional, non-seasonally adjusted figures. Contains public sector information licensed under the Open Government Licence v3.0. This is a research shortlist, not a ranking of future returns.
The spread is useful. Liverpool's recent price growth was considerably stronger than Manchester's, while Sheffield sat between them. “Northern property has high growth” is too broad a conclusion. Different cities, neighbourhoods and property types can move differently, and last year's increase is not next year's forecast.
Liverpool: investigate the price advantage carefully
Liverpool's average was £189,000, with annual growth of 8.1%. ONS also reported average monthly private rent of £913 in August 2026, up 5.6% over the year. Those figures make it worth investigating where a realistic purchase budget can meet evidenced rental demand. Source: ONS Liverpool housing data.
I would separate conventional family lets, flats and shared accommodation rather than treating them as one market. Check the exact street, intended letting use, condition, management arrangements and any applicable licensing. Do not divide the citywide rent average by the citywide purchase average and present the result as the yield available on a particular house. They are not a matched investment sample.
Newcastle: rental momentum deserves a closer look
Newcastle upon Tyne's average price was £208,000, up 4.1% annually. Average private rent reached £1,215 in August, with annual growth of 9.3%. That is the strongest rental-growth figure among the four cities for which rent figures are discussed here. Source: ONS Newcastle housing data.
The practical question is whether the property you can buy serves the tenants behind the local demand. Examine transport, access to work or study, competing stock and the letting evidence for the same property type. Strong recent rent growth should prompt investigation of affordability, not an assumption that the same percentage can be repeated indefinitely.
Sheffield: local knowledge matters more than a headline
Sheffield's July average was approximately £220,000, with annual growth of 2.8%, according to the July 2026 UK House Price Index for England. It belongs on my shortlist partly because it connects with my own documented experience, rather than simply a recent league table.
In my guide to choosing an investment area, I discuss working with Scott on sourcing, renovating and letting, including Sheffield and Northamptonshire. Repeatedly assessing properties helped build knowledge and relationships. That historical experience is useful context, but today's property still needs fresh rent evidence, quotes and due diligence. I would not base a purchase on an old transport proposal or regeneration promise without checking its current status.
Leeds: assess the property type and the price paid
Leeds recorded an average price of £248,000, up 3.8% annually. Average private rent was £1,145 in August, up 4.2%. Within the city's price data, flats were broadly unchanged over the year while semi-detached homes rose 4.7%. Source: ONS Leeds housing data.
That difference is a reminder to research the asset you intend to own. A citywide narrative cannot answer whether a particular leasehold flat has workable service charges or a house is suitable for the local tenant market. Match your rent evidence, purchase comparables and operating costs to the same kind of property.
Manchester: a recognised market still needs disciplined buying
Manchester's average price was £252,000, up 1.2% annually. Average private rent was £1,373 in August, up 4.2%. The purchase-price growth was below the North West's 4.4%, so the figures do not support assuming Manchester automatically leads every measure. Source: ONS Manchester housing data.
I would examine the actual purchase price, tenure, service charges and competing rental supply closely. A strong city reputation can already be reflected in the amount a seller asks. Compare realistic net cashflow with alternatives before paying a premium for a well-marketed address.
Why a smaller mortgage can help when rates rise
The advantage is arithmetic. An extra two percentage points of interest on £112,500 adds £2,250 a year, or £187.50 a month. On £300,000 it adds £6,000 a year, or £500 a month. These are interest-only illustrations, before fees and tax, not mortgage quotations.
This is why the purchase-price-to-rent relationship matters. A lower-priced property can have a smaller cash increase in finance costs. But its rent may also be lower, and a repair bill does not shrink automatically with the purchase price. What matters is the surplus left after the whole cost base, not whether the address is north or south.
Move the rate slider and compare two example deals
The examples start with a £150,000 property renting for £1,000 a month and a £400,000 property renting for £1,800. Both use a 75% interest-only mortgage and a combined operating allowance of 25% of gross rent for management, maintenance, voids and other running costs. These are invented deals, not city averages. Change the inputs to test your own evidence.
How much room does each deal have?
Two invented properties. Interest-only borrowing; cashflow before tax, purchase costs and principal repayment. Adjust the cost allowance to match your evidence.
| Measure | Example A | Example B |
|---|---|---|
| Gross rental yield | 8.00% | 5.40% |
| Mortgage debt | £112,500 | £300,000 |
| Extra monthly interest if rate rises 2 points | £188 | £500 |
A percentage allowance cannot capture every repair, service charge or void. No loan approval or future growth is assumed. Inputs stay in your browser and are not saved or transmitted.
At a 5% rate, the first example leaves about £281 a month and the second £100 before tax. At 7%, the first falls to about £94 and the second to a £400 shortfall. The cheaper example has more room in this particular comparison because of its yield and debt, not because Northern locations are protected from interest-rate changes. Use the full buy-to-let deal calculator for acquisition costs and a fuller assessment.
Is there more room for growth? Test affordability
A market with lower prices relative to local incomes may have more room than an expensive market, but that needs evidence. “Cheaper than London” does not establish affordability for the people who actually live and work there. Tenants and buyers have finite budgets, and higher living costs or weaker earnings can limit what they can pay.
The ONS rental-affordability analysis compares rent with household income. That is the right kind of question to bring to a location search. Check local earnings, competing rents and the likely tenant's budget instead of assuming there is no ceiling. Future growth is a scenario to test, not the condition that must rescue a weak first-year deal.
Turn a city shortlist into a property decision
Start with two areas you can realistically learn and manage. Identify the tenant, property type and total cash budget. Compare sold evidence for similar homes, obtain current local letting opinions and ask what would make the property difficult to let. Check licensing, planning, lease restrictions and safety requirements for the intended use with the relevant professionals and council.
Then stress the numbers: higher finance costs, lower rent, a longer void and a substantial repair. Use the mortgage stress calculator alongside your cashflow model. Include professional management and travel if you live far away. A headline yield can disappear when the operating plan is incomplete.
If you want help creating that plan, Starter Club provides the membership details. If you want a property sourced against a brief we agree, Done For You explains that service. The useful starting point is your budget and objectives, followed by the location and individual deal that fit them.
Frequently asked questions
Where in the UK would you start looking for buy-to-let?
For a cashflow-focused shortlist, I would investigate Northern cities including Liverpool, Newcastle, Sheffield, Leeds and Manchester. I would choose the final property using local evidence and net numbers, rather than declare one city the winner for every investor.
Are Northern properties unaffected by higher mortgage rates?
No. Smaller loans can mean a smaller increase in interest in pounds, but cashflow still falls when finance costs rise. Loan size, yield, fees and running costs determine the effect.
Which of these cities will grow fastest next?
The data here cannot answer that. They describe recent outcomes. Build a purchase that remains workable with little or no capital growth, then treat a better outcome as potential upside.